Prospektr offers a fully automated financial analysis that includes a financial projection on any property for the next 30 years. In addition, the analysis is fully tweakable by you.
When you initiate a financial analysis we build the model using data and insights we have derived for every market and every property. Some of the key inputs to the model are: property value, rent value, property taxes, property insurance costs, value appreciation, and more.
Here is a sample of the financial analysis page in Prospektr:
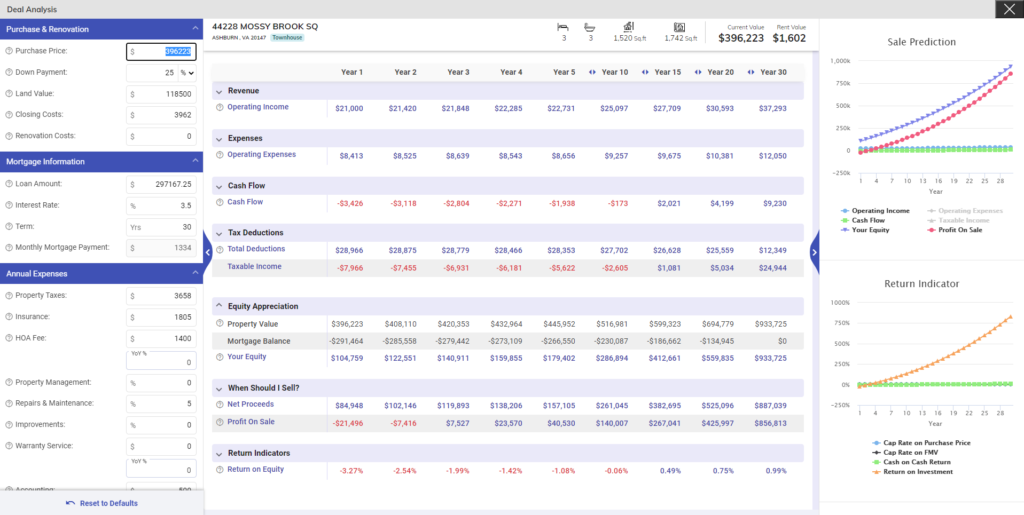
The page has 3 sections:
Model Inputs: This is the left hand side pane that is further split into sections organized by Purchase & Renovation, Mortgage Information, Annual Expenses, Rental Revenue, Value, and Sale information. You can tweak any of the numbers here to adjust the model and the charts in real time.
Financial Model: The middle of the page is where you will see the breakdown of the financial model by Revenue, Expenses, Cash Flow, Tax Deductions, Equity Appreciation, When Should I Sell? and Return Indicators (Cap Rate, Cash on Cash Return, Return on Investment).
Model Charts: The right hand side of the page provides you interactive charts for the model to easily understand the financial analysis. You can include or exclude various indicators on the charts by clicking on the items in the legend.
Each term in the model includes a definition that you can view by hovering over the “?” icon next to the term.